Your building’s numbers, kept current.
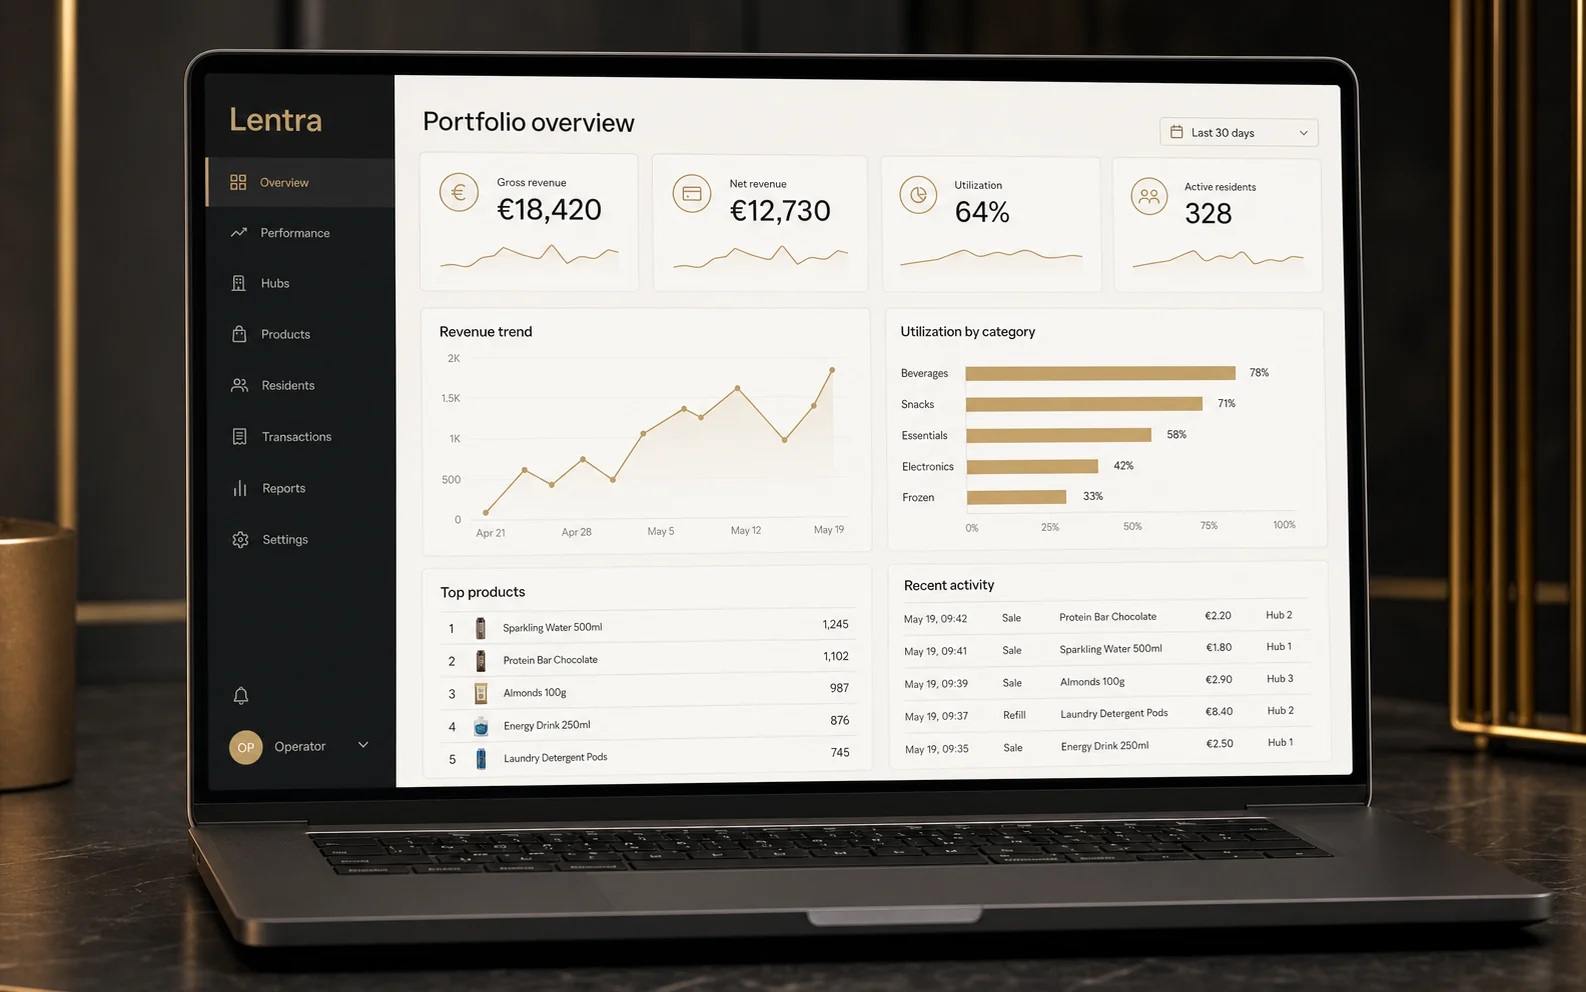
Revenue over time, month-on-month comparisons, a year-end projection you can model, trending categories and top-performing items, for your installation, updated as it runs.
Only the things that can be measured
Positioning effects are qualitative. These are the figures Lentra reports back, and they come from your building rather than a benchmark.
Revenue over time
Revenue, rentals and items sold across the period you choose.
Month-on-month
How this month compares with the last, without cherry-picking.
Year-end projection
Extends your trailing three-month average at a growth rate you set.
Trending categories
Share of revenue, and the change on last month.
Top items
What residents actually use, sortable by uses or revenue.
Your account lead
Raise a request from inside the portal. Most are handled the same day.
Sign in to your portal
Portal access is issued with your installation. If you do not have credentials yet, your account lead can set them up.
The signed-in dashboard is a live, data-driven view and is not reproduced in this preview. This page covers the public entry point only.